Experiments with eBPF: Snitchrs
Table of Contents
Introduction
In this post, I will share my experience on learning and playing with Extended Berkeley Packet Filter (eBPF). It's a very cool technology that not anyone might be aware of. It's been a while since I planned to learn some eBPF and this post has some good information for anyone who wants to get started. eBPF is a Linux kernel feature that allows to easily and safely interact with the kernel.
In order to learn how to use eBPF, I decided to implement Snitchrs a simple program that shows on a map to which IPs your computer is connecting to.
I will go through interesting snippets of code I had to write in order to implement this program. This article is not meant to be a tutorial but rather an explanation that will hopefully help you better understand useful things to know in order to write your own eBPF programs. I'll assume some basic knowledge of the TCP/IP stack and how the Linux kernel works.
extended Berkeley Packet Filter (eBPF)
eBPF stands for Extended Berkeley Packet Filter. I was pleasantly surprised when I discovered that BPF was introduced as early as 1992 (paper). The original version is sometimes referred to as cBPF, where "c" stands for classic.
As the name suggests, the initial use case for its development was filtering network packets. However, the extended BPF allows for numerous other exciting applications, as we will explore shortly.
What problem is eBPF solving and why it's so cool
Imagine you want to extend the Linux Kernel in some way, such as adding a new feature. You essentially have two main options:
- Create a patch for the Linux kernel: This option entails developing a patch specifically for the Linux kernel, which can take some time. Once the patch is completed, you will need to wait for it to be incorporated into the official kernel source code and subsequently made available through updates for your preferred Linux distribution. This process can often take several years before the patch becomes widely available.
- Create a new kernel module: This option involves developing a separate kernel module that can be loaded into the existing Linux kernel. By creating a module, you have the advantage of not directly modifying the kernel itself, reducing the risk of causing system instability or kernel panics. However, there is still a potential risk of encountering issues during and after the development of the new software, as kernel modules interact closely with the underlying kernel. Careful testing and debugging are necessary to ensure the stability and compatibility of the system with the new module.
Enter eBPF! Now, even a novice kernel hacker like myself can safely and relatively "easily" modify the behavior of the kernel using eBPF.
Writing eBPF programs
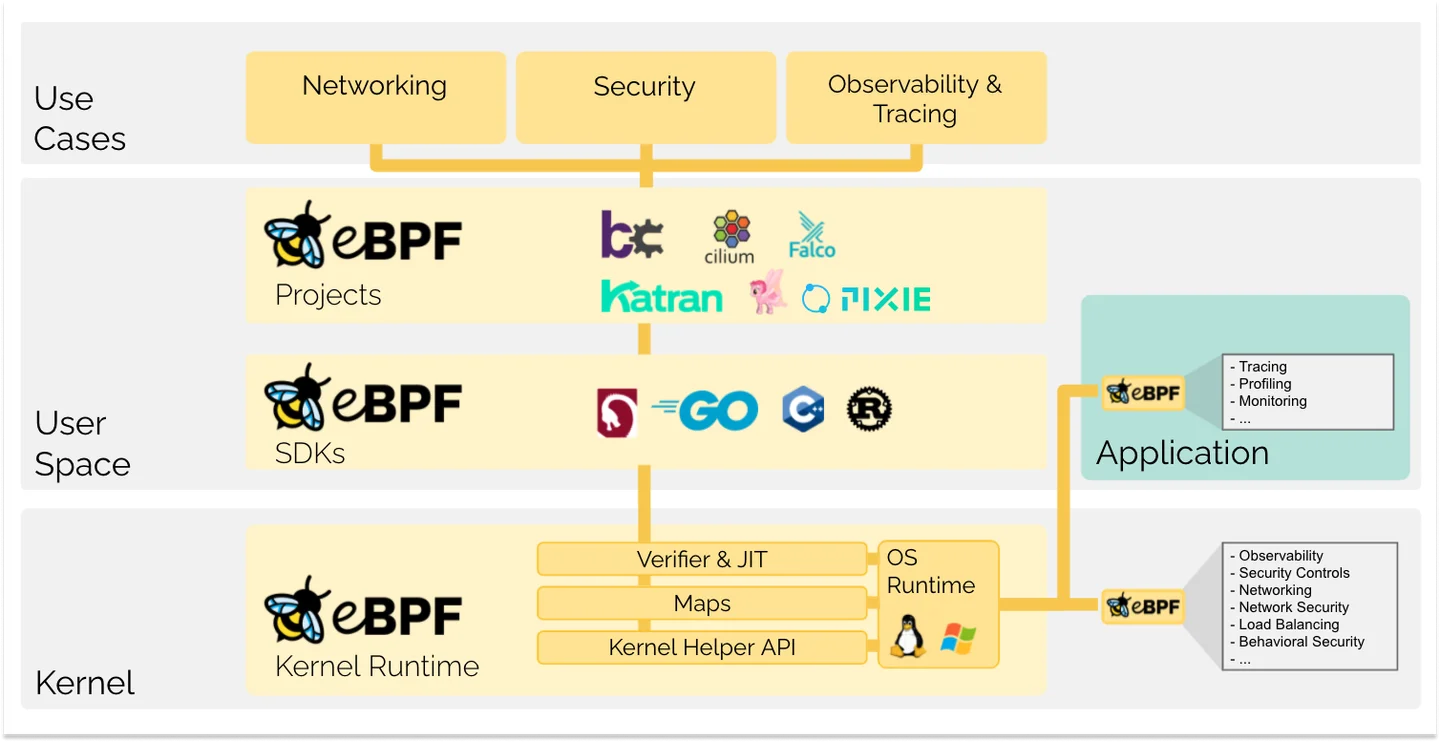
An eBPF program consists of two main components:
- A program running in kernel space: This component is composed of bytecode that executes on a virtual machine within the kernel. It is triggered by specific events or hooks in the kernel. The eBPF program running in kernel space can modify or intercept the behavior of the kernel based on the defined logic.
- A program running in user space: This component is responsible for loading the bytecode into the kernel and facilitating communication with the eBPF program. The userspace program interacts with the kernel by loading the eBPF bytecode and configuring the necessary hooks or events. It can also exchange messages or data with the eBPF program running in kernel space, allowing for coordination and data transfer between userspace and kernelspace components.
The source code for eBPF programs can be written using a restricted subset of the C language. It can be compiled using either Clang or LLVM. Once compiled, the resulting bytecode is ready to be loaded into the kernel at runtime.
During the loading process, the kernel performs a verification routine to ensure the safety and validity of the eBPF program. This verification step is crucial for preventing malicious or incorrect programs from being executed in the kernel. Once the program is verified, the Just-In-Time (JIT) compiler enables the same bytecode to be executed on different processor architectures, providing flexibility and portability.
Once the eBPF program is loaded and verified, it can be hooked up to specific events or hooks within the kernel. This allows the program to execute in response to these events, modifying or intercepting the behavior of the kernel as desired. The ability to hook into different events provides a powerful mechanism for customizing and extending the functionality of the kernel using eBPF.
Examples of some cool places where we can hook our program:
- Any time a network packet is received using the Express Data Path (XDP).
- Any time a network packet is received or sent using Classifier, which is attached to the queuing disciplines (usually referred to as
qdisc) in the Linux kernel networking module. - Any time a specific kernel function (kprobe), userspace function (uprobe) is called. We can literally spy and change the arguments to the function calls!
- Build on top of the Linux Security module to implement security systems on top of the Linux kernel.
- and a few more!
We can, for example, modify or inspect the arguments to a function or its return type.
The "hello world" eBPF program that I have come across several times is a load balancer. By utilizing the XDP interface, when the load balancer system receives a packet, it modifies the IP destination address to point to a backend system and sets itself as the source address. Naturally, it is necessary to store the mapping information in order to successfully send the response back to the client.
So now it's a good time to introduce the way that allows userspace and eBPF programs to communicate: maps.
There are many different kinds available, including a circular array buffer, hash map, queue, and bloom filter, among others. The full list can be found here.
Small bytecode for a constrained runtime
The virtual machine that runs our bytecode has some limitations that one should be aware of.
To begin with, it is important to note that loops are not allowed in eBPF bytecode. The bytecode must prioritize safety, ensuring that every memory access remains within bounds and undergoes proper checking. To enforce these checks, an eBPF verifier is in place, which operates during the load time of the bytecode. The verifier guarantees the adherence to these safety measures by enforcing the necessary checks.
For this reason, the bytecode also has a complexity limit. This limit is imposed to maintain the feasibility of the verifier's task in checking the safety of the program.
We cannot allocate memory dynamically. And finally, we only have 512 bytes of stack space. And that's it! For this reason, it's probably useful to inline some of the function calls to save some stack space (of course, if possible).
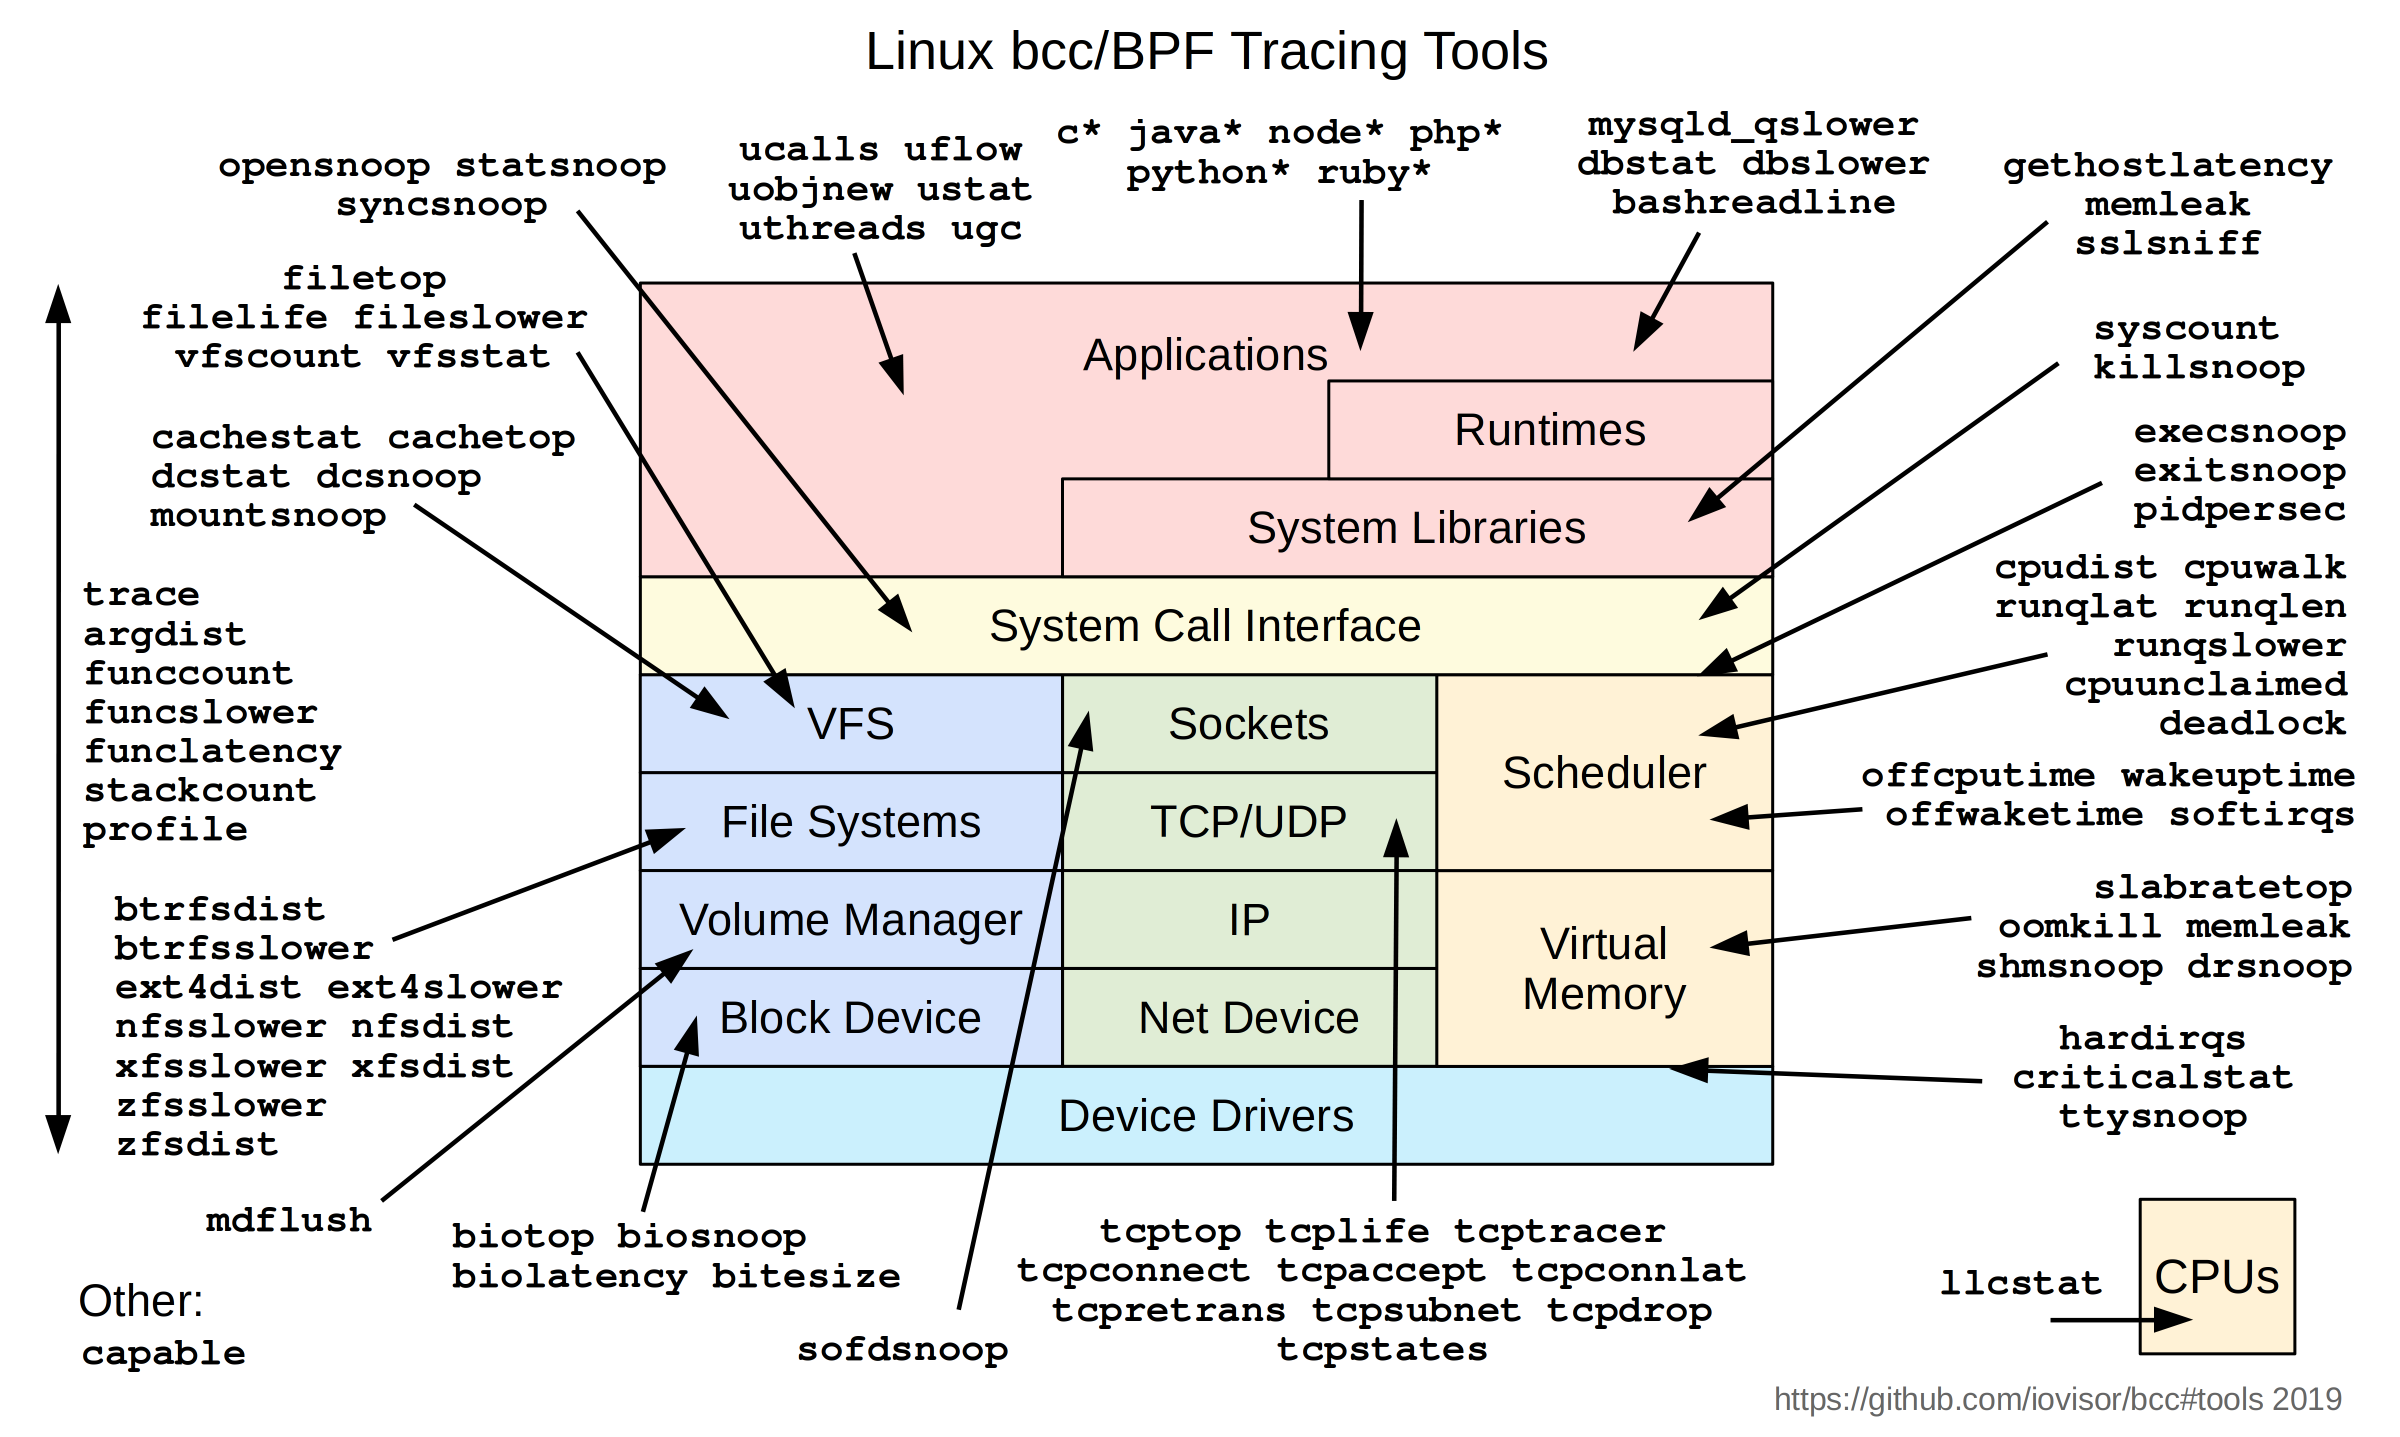
Observability
Before discussing how to start writing eBPF, it's worth knowing that there is already an extensive collection of kernel observability tools available to you in the iovisor/bcc repository. You can also use them as a starting point or draw inspiration on how to implement specific programs.
How to start writing eBPF
There are few options out there, but bcc is undoubtedly the best choice at the moment. They also maintain a Python interface that allows writing the userspace program in Python (although the bytecode itself still needs to be written in restricted C).
Here is their "hello world" example:
from bcc import BPF

# This may not work for 4.17 on x64, you need replace kprobe__sys_clone with kprobe____x64_sys_clone
BPF(text='int kprobe__sys_clone(void *ctx) { bpf_trace_printk("Hello, World!\\n"); return 0; }').trace_print()
After installing a couple of missing dependencies, it just worked. Very nice!
Some more common options to run write eBPF are:
- libbpf
- libbpfgo
- libbpf-rs
but for all of them, the bytecode still needs to be written in restricted C.
Aya: Rust all the way
Aya is a crate that allows to write both user space and kernel space using Rust.
Honestly, initially I wasn't fully convinced by the idea because one of the main reasons for choosing Rust over C is the borrow checker, and the bytecode consists mostly of unsafe Rust code throughout. However, after watching this excellent introduction presented at Berlin Rust and Tell by Michal Rostecki, I decided to give it a try.
Using Rust for the bytecode, we still enjoy benefits such as type safety and error handling using Results.
Their website may not be complete, but it provides enough information to guide me considerably. Since I wasn't very familiar with eBPF when I first explored this, I was able to set up a hello world project by following their getting started tutorial:
cargo install bpf-linker
# Adds a new cargo subcommand used to fetch the template
cargo install cargo-generate
cargo generate <https://github.com/aya-rs/aya-template>
This provides us with four crates:
- A userspace binary
- A crate containing common functions shared between userspace and eBPF
- The eBPF program
- An xtask crate that includes some magic to build the project
To build and run the project:
RUST_LOG=info cargo xtask run
Aya supports all eBPF maps and also provides a production-ready logging mechanism. It efficiently sends log messages to the userspace by utilizing the PerfEventArray from Linux's perf API. The alternative, bpf_printk, would be less efficient as it passes all messages over a single pipe.
Another cool thing: it supports async/await using tokio as runtime.
Although Aya has some limitations in terms of missing features and documentation, I found the crate to be quite usable overall, and it left me quite satisfied.
Snitchrs
When learning a new technology, whether it be a programming language, framework, or library, I find it much easier to begin by getting a small project up and running rather than attempting to read the documentation from start to finish.
Little Snitch Mini is a program that tracks outbound connections from your macOS and visualizes them on a map. It has a free version available for you to try out. Inspired by Little Snitch Mini, I decided to develop Snitchrs.
Snitchrs is a Rust-based program that utilizes eBPF to monitor new connections and track the inbound and outbound traffic for each connection.
Let's start with the demo:
To display the map, it is sufficient to monitor the source and destination IP addresses in the TCP packets. I have also planned to include additional information about which process ID is associated with each connection (along with the bandwidth usage). However, for version 1, the program only shows the IPs on a map.
The eBPF program utilizes a Classifier, a type of program that is attached to the qdisc (queuing disciplines in the Linux kernel networking module). This allows the program to make decisions regarding packets received on the network interface associated with the qdisc.
Because of where it is executed in the kernel, in this kind of hook there is no reference to the process ID responsible for sending or receiving the packet.
The idea behind the program is as follows:
- The userspace program sets up the eBPF program and hooks it up to the
ingressandegress. - The userspace program receives messages from the eBPF program containing network information (such as new connections or closed connections) and prints them out.
- Another separate program reads from stdin and displays the exchanged traffic on a UI.
Common code
The messages are exchanged using the PerfEventArray map. In this case, only the eBPF program writes to the userspace program.
A Snitchrs event is structured as follows:
#[derive(Copy, Clone)]
#[repr(C)]
pub enum SnitchrsEvent {
    Connect {
        remote_ip: u32,
        remote_port: u16,
        local_port: u16,
        direction: SnitchrsDirection,
    },
    Traffic {
        remote_ip: u32,
        remote_port: u16,
        local_port: u16,
        payload_size: u16,
        direction: SnitchrsDirection,
    },
    Disconnect {
        remote_ip: u32,
        remote_port: u16,
        local_port: u16,
        direction: SnitchrsDirection,
    },
    ConnectFunc {
        destination_ip: u32,
        pid: u32,
        destination_port: u16,
        padd: u16, // Used for padding to avoid errors with the eBPF verifier. See point #10: <https://docs.cilium.io/en/v1.7/bpf/>
    },
    AcceptFunc {
        source_ip: u32,
        pid: u32,
        source_port: u16,
        padd: u16, // Used for padding to avoid errors with the eBPF verifier. See point #10: <https://docs.cilium.io/en/v1.7/bpf/>
    },
}
The shared crate in the template proves to be useful in this context.
The repr(C) attribute is necessary to obtain the byte representation of the enum, which is compatible with what C expects. Otherwise, Rust tends to reorder the entries for memory optimization. More information can be found here. The padding is a quick solution to resolve the "invalid indirect read from stack" error I encountered with the eBPF verifier (described here).
In addition to the classifier related events, there are also events called ConnectFunc and AcceptFunc. These events are generated in a different way and are included because I wanted to explore their use in tracking the PIDs of the processes utilizing these connections. I provide more information about this in a later section.
User Space side
The userspace program is mostly boilerplate:
let program: &mut SchedClassifier = bpf.program_mut("snitchrs").unwrap().try_into()?;
program.load()?;
program.attach(&opt.iface, TcAttachType::Egress)?;
let program: &mut SchedClassifier =
    bpf.program_mut("snitchrs_ingress").unwrap().try_into()?;
program.load()?;
program.attach(&opt.iface, TcAttachType::Ingress)?;
The opt.iface represents the interface to which we want to attach the eBPF program. Since we want to monitor both directions, we need to attach it to both ingress and egress.
To obtain a reference to the shared array:
let mut perf_array = AsyncPerfEventArray::try_from(bpf.take_map("EVENT_QUEUE").unwrap())?;
The PerfEventArray is one per CPU. Therefore, there is some boilerplate code that spawns a tokio task for each CPU to print the events as they are received.
for i in 0..events.read {
    let buf = &mut buffers[i];
    let ptr = buf.as_ptr() as *const SnitchrsEvent;
    let snitchrs_event = unsafe { ptr.read_unaligned() };
    println!("{}", snitchr_to_string(&snitchrs_event)?)
}
Whenever we read from this map, a system call is made to fetch the item.
One event is printed per line, and the format is straightforward for parsing:
<direction>_connect remote_ip:remote_port :local_port: emitted on every tcpsinpacket.<direction>_disconnect remote_ip:remote_port :local_port: emitted on every tcpfinpacket<direction>_traffic remote_ip:remote_port :local_port transfered_bytes: emitted on every tcp packet that is not sin nor fin.syscall_<connect|accept> remote_ip:remote_port pid: emitted on every syscall call toconnectandaccept.
Some sample events that will be printed by this program to stdout:
syscall_connect 172.104.141.216:80 364801
egress_connect 172.104.141.216:80 :55518
ingress_connect 172.104.141.216:80 :55518
egress_traffic 172.104.141.216:80 :55518 13312
egress_traffic 172.104.141.216:80 :55518 32000
ingress_traffic 172.104.141.216:80 :55518 13312
ingress_traffic 172.104.141.216:80 :55518 10242
egress_traffic 172.104.141.216:80 :55518 13312
egress_disconnect 172.104.141.216:80 :55518
ingress_disconnect 172.104.141.216:80 :55518
That covers most of the userspace part. The UI is discussed later.
Kernel space: eBPF
To begin, we need to deserialize the network packets to something we can access.
We are interested only in TCP traffic. Due to the way a network packet is designed, in order to deserialize the packet into something we can easily access, we would need to define structs for the Ethernet header, the IP header, and the TCP header. Since this is both boring and error-prone, we can simply add network-types = "0.0.4" as our dependency.
Using the TcContext it's easy to filter out packets that are not of our interest:
fn try_snitchrs(ctx: TcContext, ingress: SnitchrsDirection) -> Result<(), ()> {
    let ethhdr: EthHdr = ctx.load(0).map_err(|_| ())?;
    match ethhdr.ether_type {
        EtherType::Ipv4 => {}
        _ => return Ok(()),
    }
    let ipv4hdr: Ipv4Hdr = ctx.load(EthHdr::LEN).map_err(|_| ())?;
    if ipv4hdr.proto != IpProto::Tcp {
        return Ok(());
    }
The TC_ACT_PIPE action tells Tc to keep the packet flowing. We could potentially discard it using TC_ACT_SHOT, for example.
Finally, we can begin assembling some information together:
let destination_ip = u32::from_be(ipv4hdr.dst_addr);
let source_ip = u32::from_be(ipv4hdr.src_addr);
let transport_hdr_offset = EthHdr::LEN + Ipv4Hdr::LEN;

let tcp_hdr: TcpHdr = ctx.load(transport_hdr_offset).map_err(|_| ())?;
let destination_port = tcp_hdr.dest;
let source_port = tcp_hdr.source;
The IP can be found in the IP header, and ports are a transport-level concept.
For the payload size, the ip header has a "total length" field from which we need to remove the size of the ip and tcp headers:
let payload_size = ipv4hdr.tot_len - Ipv4Hdr::LEN as u16 + TcpHdr::LEN as u16;
The SYN (Synchronize) flag in the TCP header is used to initiate a connection between two hosts. The FIN (Finish) flag is used for closing a connection: after a packet with the FIN flag is sent, no more TCP packets can be sent over that connection in that direction.
We can finally create an event and send it over the queue:
EVENT_QUEUE.output(&ctx, get_event(...), 0);
And this is basically it!
Getting the PID along with the socket?
Each eBPF program has helper functions. The full list is available here. The catch is that they won't work for every bpf program. For example, there is this function:
u64 bpf_get_current_pid_tgid(void)
Return A 64-bit integer containing the current tgid and
pid, and created as such:current_task->tgid << 32|current_task->pid.
That looks quite handy but cannot be run from within a "classifier" kind of program. I think this limitation might be due to the fact that in the qdisc, we are working at a level in which we still don't know to which pid this packet will be routed to. So, how can I associate each packet with a specific PID?
Let's start by acknowledging that I haven't researched much on how to actually do it. Later, I stumbled upon this article by Datadog that discusses capturing the accept and connect syscalls. I was also curious about how to achieve it because it might be useful for future programs. Therefore, I decided to include it, although it doesn't directly solve my problem as it lacks the reference to the local port in that specific context. I believe the solution to my problem lies in this code, as it implements a very similar program (you can check the example here). However, this is something to address in a later update. For now, I would like to quickly explore how to inspect function calls in both userspace and kernelspace!
Kprobe, uprobe
Kernel and User probes are eBPF programs that can be attached to specific user space or kernel space functions.
This allows us, for example, to execute some code whenever someone calls the strlen function from libc. Or execute some code whenever the connect and accept syscalls are invoked!
Probes can be attached before a function is called or after. If the former, we have access to its arguments; if the latter, we have access to the output of the function.
accept is a syscall used by a server to accept a connection, whereas connect is used whenever we want to connect to an IP.
Both take as input a struct sockaddr object that has the following structure
Ref:
struct sockaddr {
    unsigned short    sa_family;    // address family, AF_xxx
    char              sa_data[14];  // 14 bytes of protocol address
};
After checking the sa_family, we can cast it to a sockaddr_in to simplify accessing the fields.
// (IPv4 only--struct sockaddr_in6 for IPv6)
struct sockaddr_in {
    short int          sin_family;  // Address family, AF_INET
    unsigned short int sin_port;    // Port number
    struct in_addr     sin_addr;    // Internet address
    unsigned char      sin_zero[8]; // Same size as struct sockaddr
};
We can access these structs from rust by generating the bindings using bindgen like this:
bindgen --use-core /usr/include/linux/in.h > bindings_linux_in.rs
I would like to discuss how the accept was implemented, as the connect is relatively easier.
To achieve this, I followed the Datadog article linked above. The idea is as follows:
The accept syscall takes a reference to a sockaddr as input. After the accept is completed, the client's IP and port are stored in the sockaddr struct. However, when the accept is called, the struct is empty. Therefore, if we hook our eBPF program at the beginning of the call, the client information would not be available. On the other hand, if we hook it at the end of the call, we won't have a reference to the function's arguments anymore. How can we work around this?
The solution is to have two eBPF functions:
- One hooked at the beginning of the syscall. It will use the PID+TID as a key and insert a reference to the
sockaddrstruct in a map. - A second program hooked at the return of the
acceptsyscall. This program will retrieve the reference tosockaddrfrom the map and obtain the newly populated information about the client.
To attach the kprobe at the beginning, we can use the kprobe macro. To attach it at the end, we can use the kretprobe.
#[kprobe(name = "snitchrs_syscall_accept")]
fn try_kprobe_syscall_accept()
#[kretprobe(name = "snitchrs_syscall_accept_ret")]
fn try_kprobe_syscall_accept_ret()
When invoked, the kprobe will add the TID of the process and a reference to the sockaddr_in argument to a map. The kretprobe will then access the map using the TID and retrieve the newly populated struct.
#[inline]
fn try_kprobe_syscall_accept_ret(ctx: &ProbeContext) -> Result<u32, i64> {
    // int accept(int sockfd, struct sockaddr *addr, socklen_t *addrlen);
    // int accept4(int sockfd, struct sockaddr *addr,socklen_t *addrlen, int flags);
    let as_addr = unsafe {
        ACCEPT_TID_ARGS_MAP
            .get(&bpf_get_current_pid_tgid())
            .ok_or(1i64)?
    };
    ACCEPT_TID_ARGS_MAP.remove(&bpf_get_current_pid_tgid())?;

    let sock_addr: *const sockaddr = (*as_addr) as *const sockaddr;
While accept is a POSIX syscall, accept4 is a Linux-specific extension that includes a flags argument. Since you are using only the first two arguments, you can reuse the same kprobe and attach it to both syscalls.
Another important aspect to note is the following code snippet:
let family = unsafe { (bpf_probe_read_user(&*sock_addr).map_err(|_e| 5i64)? as sockaddr).sa_family };
Depending on where the data is stored (kernel/user space), we have access to bpf_probe_read_[user|kernel] functions. The documentation describes read_user as:
This attempts to read bytes from user address space to the BPF stack so that BPF can operate on it. For safety, all user address space memory reads must pass through bpf_probe_read_user().
That's essentially it. The remaining code involves creating the event with the data and sending it over the PerfEventArray.
Syscalls
For hooking up these syscalls, it's important to know that in the kernel, they are wrapped in macros like this:
SYSCALL_DEFINE3(execve,
		const char __user *, filename,
		const char __user *const __user *, argv,
		const char __user *const __user *, envp)
{
	return do_execve(getname(filename), argv, envp);
}
The execve syscall is then translated to something like int __x64_sys_execve(struct pt_regs *regs).
This has two effects:
The first is that the accept syscall is not called accept. So when we want to hook it up, we need to know its actual name. To address this, I contributed to Aya by adding a function called syscall_prefix(), which returns a &'const str representing the prefix. We need to use this function whenever we want to hook up to a syscall.
program.attach(&format!("{}accept4", syscall_prefix())?, 0)?;
The second effect is that your input is wrapped in the pt_regs struct. Aya provides the PtRegs struct, making it easy to use:
pub fn try_kprobe_accept_tcp(ctx: &ProbeContext) -> Result<u32, i64> {
    let regs = PtRegs::new(ctx.arg(0).ok_or(1u32)?);
    let sock_addr: *const sockaddr = regs.arg(1).ok_or(2i64)?;
    ...
User Interface
I won't spend much time discussing the UI as it's out of scope for this post. Snitchrs outputs events to stdout, and I chose to implement the UI using Python and QT because it allowed me to quickly set up a functional interface.
The map is implemented using Leaflet and runs within an HTML widget. I can invoke JavaScript functions whenever we need to update the map and add a new IP. Currently, only IPs are added to the map, but the functions to remove edges are already implemented. The map is updated with new information every 1 second.
I haven't given much thought to how the UI should look or what information to display, and I believe it shows. If I have some time, I will try to create proper mockups and improve the visual design.
Open questions and next steps
My first question is: how to actually test these programs?
End-to-end testing after every change is easy when the logic to test is straightforward, but as the program grows in complexity, testing becomes necessary. I'm not sure if there is an easy way to do it, but I also haven't spent much time thinking about it. My initial thought would be to use a virtual machine, run the program, and verify the output. However, I'm unsure of the time required to set up a proper CI for this purpose.
Another question I have is about the efficiency of this approach. Based on what I've read, it is incredibly efficient. I would be curious to profile a real application that utilizes BPF to gain a better understanding of its performance.
The next steps for Snitchrs are as follows:
- Add PID tracking: This requires both UI and implementation changes. I need to delve deeper into how the BCC program works and incorporate relevant ideas.
- Implement CI: I'm unsure of the ease of setting up a CI system, but having one for Snitchrs would be great. It could potentially be reused in the eBPF community for other projects (assuming it doesn't already exist 🙂).
- Refactor the UI: Spend more time to consider the UI design, create mockups, and potentially reimplement it in Rust.
- Explore portability across different operating systems.
- Consider packaging options for Snitchrs.
Conclusions and remarks
In this post, I have shared my experiments with eBPF while implementing Snitchrs, a tool to visualize the IPs to which your laptop is connecting.
I have provided a brief overview of eBPF and discussed the challenges and interesting snippets I encountered during the implementation of this program.
eBPF is a powerful tool, and it is relatively easy to get something working. However, implementing more complex functionalities beyond a simple "hello world" requires considerable effort. The documentation is generally lacking, and there are limited online resources available, making it challenging to debug eBPF verifier errors. Nevertheless, the assurance that the program won't crash the kernel makes it a much easier framework to work with compared to kernel modules.
Using aya allows for eBPF implementation in Rust, from userspace to kernelspace. Although aya is still a relatively young project, it provides a pleasant development experience, especially if Rust is already part of your stack.
I would greatly appreciate your feedback on this article! If you have any comments, questions, or just want to say hi, feel free to send me an email at me+blog@fponzi.me, reach out to me on Twitter, or find me on Mastodon.
Happy hacking!
Resources and references:
These are some references I've used to learn more about eBPF:
- Book: Learning eBPF by Liz Rice - ISBN: 9781098135126 - very recommended.
- https://ebpf.io/what-is-ebpf/
- https://github.com/rust-bpf/rust-bcc
- https://jvns.ca/blog/2018/02/05/rust-bcc/
- https://github.com/iovisor/bcc/blob/master/INSTALL.md
- https://raw.githubusercontent.com/iovisor/bcc/master/examples/hello_world.py
- https://aya-rs.dev/
- https://www.youtube.com/watch?v=t996ZkbWnEs
- https://docs.cilium.io/en/stable/bpf/architecture/
- https://www.brendangregg.com/blog/2019-01-01/learn-ebpf-tracing.html
- Snitchrs on GitHub
Acknowledgements
Thanks to Federico Scozzafava for useful feedback on this article.